Row Table Analysis
I spent the weekend implementing code to analyze bit densities in the rows and columns of the row tables. This tool should help us determine whether the row tables are configured correctly. A good row table should have the following characteristics:
- Each column’s density is close to the system target density.
- Each row’s density is close to the system target density.
- Random pairs of terms are unlikely to share rows.
- All rows assigned to a single term should be distinct.
To test the tool, I did a quick row table analysis for two corpuses.
The first was the collection of Shakespeare Sonnets in
TheBard.
The second corpus consisted of the first 1805 documents from our
processed Wikipedia dump
(chunks AA\\wiki_00 to AA\\wiki_09).
The remainder of this post describes my methodology and some early observations.
Methodology
I used the new -script option to BitFunnel replto start
the repl and then execute commands from the file ingest.txt:
% BitFunnel repl -script ingest.txt /tmp/wikipedia/config
The -script option is a huge time saver.
Here are the commands inside of ingest.txt.
cache chunk /tmp/wikipedia/enwiki-20161020-chunked1/AA/wiki_01
cache chunk /tmp/wikipedia/enwiki-20161020-chunked1/AA/wiki_00
cache chunk /tmp/wikipedia/enwiki-20161020-chunked1/AA/wiki_02
cache chunk /tmp/wikipedia/enwiki-20161020-chunked1/AA/wiki_03
cache chunk /tmp/wikipedia/enwiki-20161020-chunked1/AA/wiki_04
cache chunk /tmp/wikipedia/enwiki-20161020-chunked1/AA/wiki_05
cache chunk /tmp/wikipedia/enwiki-20161020-chunked1/AA/wiki_06
cache chunk /tmp/wikipedia/enwiki-20161020-chunked1/AA/wiki_07
cache chunk /tmp/wikipedia/enwiki-20161020-chunked1/AA/wiki_08
cache chunk /tmp/wikipedia/enwiki-20161020-chunked1/AA/wiki_09
cd /tmp/wikipedia/out
analyze
The first 10 lines ingest chunks AA/wiki_01 to AA/wiki_09 while caching
their IDocuments. It is important to use the cache command here because
the column density analysis is only performed for IDocuments that are cached.
The cd command on the next line sets the output directory to /tmp/wikipedia/out.
This is where the row table analyzer will put its output files.
Finally, the analyze command kicks off the row table analysis which generates the following files:
- /tmp/wikipedia/out/ColumnDensities.csv
- /tmp/wikipedia/out/ColumnDensitySummary.txt
- /tmp/wikipedia/out/RowDensities-0.csv
Column Densities in Wikipedia
The column densities are recorded as a table in a .csv file. Here’s what the file looks like in Excel:
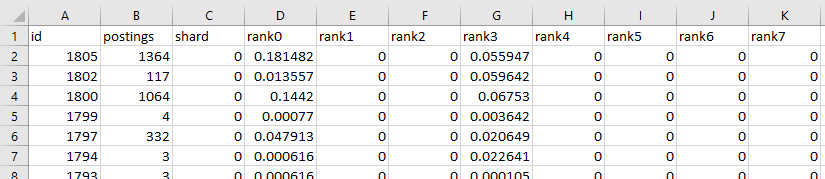
The first column is the document id, which in the case of wikipedia
is the curid value. For example, cell A2 has an id of 1805 which
corresponds to the
Wikipedia page on Antibiotics
(full url is https://en.wikipedia.org/wiki?curid=1805).
Column B contains the number of postings contributed by each document.
We can see from cell B2 that the page on Antibiotics contributes
1364 postings. Column C has the shard the document is stored in.
For these runs, the index was configured with a single shard, so the column
is all zeros. Columns D through K have the bit densities of the
document’s column at ranks 0 to 7, respectively.
Note that this index was configured to use only ranks 0 and 3.
We can learn a lot about the index by examining a scatter plot of column density vs. document posting count. In the chart below, blue dots represent rank 0 densities and orange dots represent rank 3 densities.
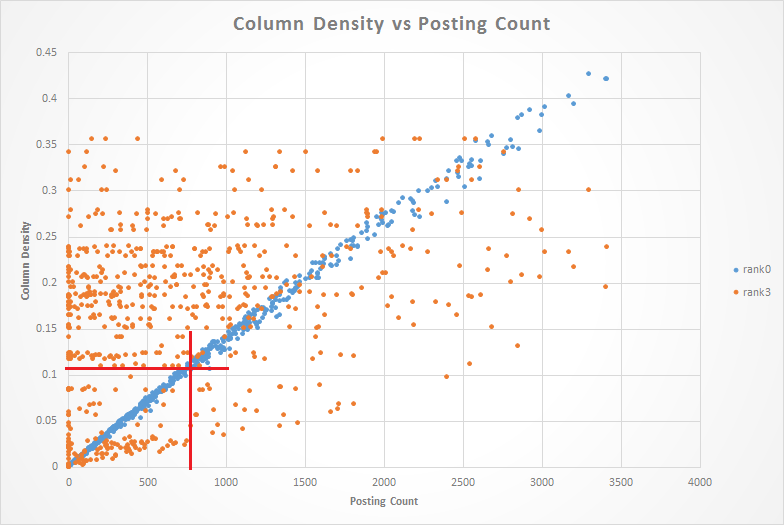
Right off the bat, the structure of the graph suggests two learnings.
The Need for Sharding The first learning is that we will need to shard the index by posting count. An examination of the blue dots shows that column density is directly proportional to document posting count. In other words, short documents have low column densities and long documents have high column densities.
This index was sized to accomodate the average sized document which has 766 postings. If we follow the red line up from 766 postings, it hits the blue dots near a density of 0.1 which was the target density used in the index configuration.
In this index, documents with less than 766 postings will consume more memory than necessary, while documents with more than 766 postings will contribute to an increased false positive rate.
We knew from Bing that we would need to shard the index into groups of documents with similar posting counts. This scatter plot just confirms the need for sharding.
A Bug in Rank 3? The cloud of orange dots is problematic in that it doesn’t show The expected linear structure and it includes many densities above the target of 0.1.
An examination of the TermTable builder code shows two design flaws that could potentially lead to excess density in higher rank rows.
The first problem is that each term is associated with a set of rows that are either all adhoc or all explicit. In some cases, a term has a low enough frequency to be adhoc at rank 0, but high enough to require explicit row assignment at rank 3. With the current algorithm, such a term’s rows will all be adhoc, leading to the overfilling of some rows at higher ranks.
This is a problem that exists in the current Bing codebase and explains why they sometimes have rows with unexpectedly high density.
The second problem is that the term treatment allows higher rank rows when their use would precipitate densities about the target density. Suppose, for example, that we have a term that appears in 5% of the corpus and its term treatment calls for two shared rows, one at rank 0 and the other at rank 3. The bin packing algorithm will ensure that the rank 0 row is not overfilled. The problem comes in the rank 3 row where the 5% bit density translates to 18.4% of the bits being set. In this case, the bit packing algorithm will forced to allocate a private rank 3 row, when a better choice might have been to allocate a lower rank row that could be shared with other terms.
Until we fix these problems we won’t be able to see whether there are other less impactful bugs lurking in the background.
Row Densities in Shakespeare Sonnets
The row density table seems to show the same issues with excess density
in higher rank rows. The row table analyzer outputs one row density file
for each shard. For this run, our index only has one shard,
so its data appears in RowDensities-0.csv.
This is a .csv file with a ragged right edge.
Each line in the file corresponds to the term listed in column A.
Column B shows the term’s frequency in the corpus used during the
statistics collection phase (BitFunnel statistics). In the excerpt
below, we can see that the term Sonnet appears in 100% of the documents
while the term but appears in 71.4%.
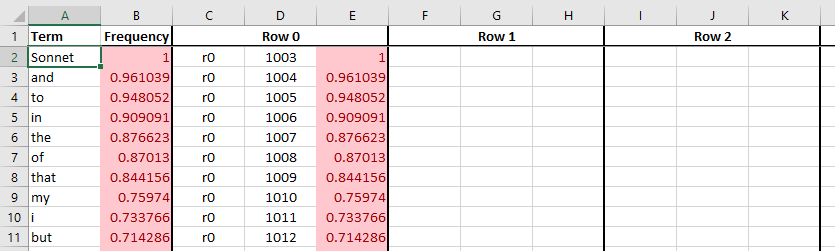
Columns C through E give the rank, row index, and observed density
of the first row associated with each term. Columns F through H
correspond to the second row, and so on. In the excerpt above, we
can see that common terms correspond to a single private row. Since
the row is not shared with other terms, its density can be above the
target of 0.1.
Note that in the excerpt above, the
term frequency in column B is exactly equal to the fraction of bits
detected in column E, even though the corpus statistics were gathered
from a slightly different corpus. These values aren’t required to be
equal, but it is not suprising that they are equal for the most common
terms.
In the excerpt below, we can see that at some point, less common terms
begin to share rows. As soon as a term shares rows, it needs at least one additional
row to drive down the noise. The term things is common enough to get
its own, private row, while gentle is assigned to a pair of rows that
are shared with other terms.
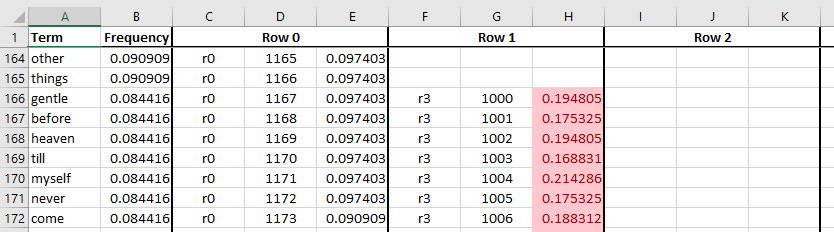
The red highlight shows the bug rearing its ugly head in the rank 3
rows. As an example, the term gentle has a density of 0.19 in a
rank 3 row. If row 1000 is shared, its density will lead to an
unexpectedly high false positive rate in queries involving terms that
share rank 3 row number 1000. If, on the other hand, row 1000 is
private, we may be wasting storage.
This problem becomes less prominent as terms get rarer. In the excerpt
below, we see that wrinkes gets two shared rows, while seek gets
three. In this portion of the table, all of the densities are
below the target level of 0.1.
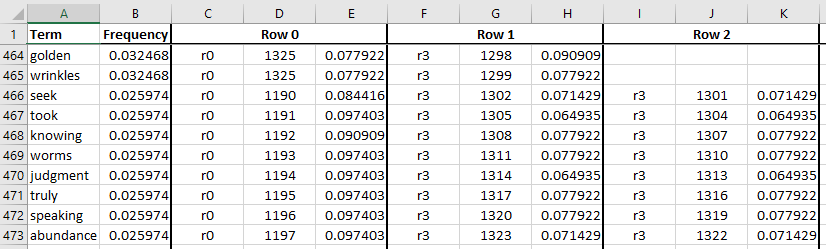
It is a bit suspcious that the rank 3 rows for rare terms seem to densities that are below the target density. This might be a result of the bug directing bits to the wrong rows, or it could mean that we’ve somehow overprovisioned these rows and are wasting memory.
It is great to have these analysis tools to get a handle on problems in the row tables.