Debugging Bit Densities
Things are starting to get exciting in the Land of BitFunnel. We’re now at the point where we can ingest a significant fraction of Wikipedia and run millions of queries, all without crashing – and we have a great set of analysis tools.
You might think that the end is in sight, but actually this is only the beginning. We’re now in what I like to call a “target rich environment” for bugs. Today there are so many bugs, data cleaning issues, and configuration errors that the only reliable statement we can make about the system is that it has bugs.
Having lots of bugs might sound scary or frustrating, but this is actually one of the most interesting stages of the project – when we bring everything together for the first time. I’ll make an analogy to the Boeing 787 Dreamliner.
The components were designed, manufactured and tested separately and then one day they were brought together and assembled for the first time into an airliner. There were some initial hitches getting everything to fit together, but before you knew it they were doing high speed taxi tests and then preparing for the first flight.
I spent the day bolting on the wings and spooling up the engines. My focus was primarily on the bit densities in the Row Tables.
Methodology
My experiments were based on enwiki-20161020-chunked1.
After downloading and unzipping this file, I made a manifest file listing all 236 chunks in the corpus.
This can be done on Windows with the dir command:
d:\temp\wikipedai> dir /s/b/a-d enwiki-20161020-chunked1 > manifest.txt
or on Linux with the find command:
% find enwiki-20161020-chunked1 -type f > manifest.txt
I then generated corpus statistics, built the term table, and started an analysis in the repl:
% mkdir /tmp/wikipedia/config
% BitFunnel statistics -text /tmp/wikipedia/manifest.txt /tmp/wikipedia/config
% BitFunnel termtable /tmp/wikipedia/config

% mkdir /tmp/wikipedia/analysis
% BitFunnel repl /tmp/wikipedia/config

Welcome to BitFunnel!
Starting 1 thread
(plus one extra thread for the Recycler.)

directory = "/tmp/wikipedia/config"
gram size = 1

Starting index ...
Index started successfully.

Type "help" to get started.

0: cache manifest /tmp/wikipedia/manifest.txt
Ingesting manifest "/tmp/wikipedia/manifest.txt"
Caching IDocuments for query verification.
Ingestion complete.

1: cd /tmp/wikipedia/analysis
output directory is now "/tmp/wikipedia/analysis".

2: analyze
This generated a number of files in the analysis directory,
including RowDensities-0.csv which easy to view it in Excel.
Picking Low Hanging Fruit
My interest today was the densities of the rank 3 rows, where my earlier investigations suggested there might be bug.
Right off the bat, I found a really high density in a rank 3 row for the adhoc term scriptura.
Cell Q47193 shows a density of 0.652111 in row 2353. This is way above the target density
of 0.1 and something that needs to be addressed.

So how did the row density get so high? My first line of inquiry was to examine the other terms
that share row 2353 with scriptura. To do this, I modified RowTableAnalyzer::AnalyzeRowsInOneShard()
to print out the term text and frequency whenever row.GetIndex() == 2353 && row.GetRank() ==3.
Near the top of the function, I recorded the index of the row under observation, created a counter
for terms in the row and a CsvTableFormatter to print out the terms. This latter was necessary to properly
escape terms that contain commas (e.g. 10,000).
    const RowIndex specialRow = 2353;
    size_t specialTermCount = 0;
    CsvTsv::CsvTableFormatter specialFormatter(std::cout);
    std::cout << "Special row is " << specialRow << std::endl;
In the middle of the loop, I added code to print out information about each term in the special row:
    if (row.GetRank() == 3 && row.GetIndex() == specialRow)
    {
        std::cout
            << specialTermCount++
            << ",";
        specialFormatter.WriteField(termToText.Lookup(term.GetRawHash()));
        std::cout
            << ","
            << dfEntry.GetFrequency();
        specialFormatter.WriteRowEnd();
    }
Here are the results. There were 752 terms in row 2353, but as you can see, the sum of their frequencies is 0.102110806, a value that is pretty close to the target density of 0.1.
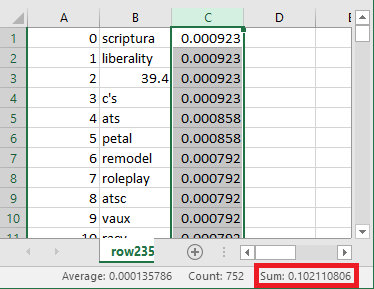
At first glance the fact that the frequencies sum up to .0102110806
suggests that the bin packing algorithm in
TermTableBuilder::RowAssigner is working correctly.
But wait – these are term frequencies which only correspond to densities
at rank 0. At higher ranks, the densities are magnified because each bit
at rank corresponds to multiple rank 0 bits.
After a brief investigation, I found that we were, in fact,
under counting bits added to adhoc rows.
In RowAssigner::AssignAdhoc() we keep a running total of the density
contributed by adhoc terms:
m_adhocTotal += frequency * count;
Later we’d use m_adhocTotal to compute the number of rows needed to store
adhoc terms:
double rowCount = ceil(m_adhocTotal / m_density);
The precise problem is that each bit in a rank 3 row corresponds to 8 bits at rank 0, so the density in rank 3 will be significantly higher than the term’s frequency at rank 0. A small change addressed this issue:
double f = Term::FrequencyAtRank(frequency, m_rank);
m_adhocTotal += f * count;
This fix had a big impact, dropping scriptura row densities to the .20-.30 range.

This was a nice improvement, but the densities were still 2-3x what they should be.
It turns out the there was another bug, this time in Term::FrequencyAtRank()
(thanks to @danluu for spotting the error!)
The original code computed
return 1.0 - pow(1.0 - frequency, rank + 1.0);
The corrected code is
size_t rowCount = (1ull << rank);
return 1.0 - pow(1.0 - frequency, rowCount);
With these two fixes, the scriptura densities are all below 0.15:

An examination of other rows shows that the fix works for all adhoc rows. We still have a ways to go if we want all shared rows to have a density at or below 0.10, but we’ve made good progress.
One More Thing: During the course of this investigation, I noticed that some of the terms in the
index contain punctuation (e.g. 39.4 and c's) and others are capitalized.
It turns out that our Workbench
tool which uses Lucene’s analyzer to tokenize
the Wikipedia page bodies was letting the page titles pass through without analysis.
We should have a fix for this shortly and then we will reprocess Wikipedia and
upload new chunk files.
Where Things Stand
This a classic case of little bugs hiding behing big bugs. We’re also in a situation where we have bugs on multiple axes, making it hard to reason about why we’re seeing certain behaviors.
As an example, we know that query processing is slow. We expected it to be slow because we’re using the byte code interpreter instead of NativeJIT and because we indulged ourselves in some potentially expensive operations in the glue code (e.g. excess allocations and copies, lock contention, and calls to qsort).
The problem is that we don’t really know how fast query processing should be with the current design choices. It might be slow because of the reasons above, or it might be even slower because our row densities are too high, causing excess row reads, or our false positives are too high, causing too many results.
Or we might have a performance bug, say running each query twice when we thought we were running it once.
There are so many possibilities, that we just need to take one suspsicous piece of data at a time, come up with a single example, be it a bad row or a bad query and instrument it or trace it through.
Over time we will pick enough of this low hanging fruit that we generally trust the system and bugs will become more of an aberration.