Debugging unfamiliar code
This is a story about debugging a register allocation issue in a compiler. I recently joined the Bitfunnel project; there wasn’t much documentation at the time, so I started playing with the code by writing some simple examples that could later serve as documentation to anyone else coming in after me. The first thing I tried this for was NativeJIT, both because it’s self-contained and because it’s the first thing we open sourced. To my surprise, compiling the simplest example I could think of (a function that computes the area of a circle) exposed two optimization bugs. Since we’re trying to be transparent, I put the example in our README and then started looking into debugging the bugs.
At the time, I was pretty much totally unfamiliar with the codebase, and also not used to writing software on Windows, so this seemed like a good opportunity to explore the codebase a bit, and learn how the standard Visual Studio dev/debugging workflow works on Windows.
Let’s look at the example I tried to compile, which computes PI * r * r (in C++, since NativeJIT is C++):
// Our area expression will take a single float parameter and return a float.
// f(r) = PI * r * r
Function<float, float> expression(allocator, code);

// Multiply input parameter by itself to get radius squared.
auto & rsquared = expression.Mul(expression.GetP1(), expression.GetP1());

// Multiply by PI.
const float  PI = 3.14159265358979f;
auto & area = expression.Mul(rsquared, expression.Immediate(PI));

// Compile expression into a function.
auto function = expression.Compile(area);

// Now run our expression!
float radius = 2.0;
std::cout << "The area of a circle with radius " << radius
          << " is " << function(radius);
The API we have is that we build up an expression tree, call .Compile on the tree to get a function that we can call, and then call the function. This compiler is used in Bing, where the expression tree is built up programmatically, but in this case we’re just going to manually construct a Mul node that computes r*r, and then construct another Mul node that takes the output of the first Mul node and multiplies it by PI.
If we think about what code should be generated, we’d expect that the parameter, r, should be passed into an input parameter register (maybe xmm0). Then we’d expect that xmm0 is multiplied by itself to produce r*r, and then multiplied by our constant, PI and returned in the same register. But if we look at the assembly output, we can see that something strange is going on:
PI_CONSTANT:
db 0f 49 40                          ; PI is stored in memory as a constant.
ENTRY_POINT:
sub     rsp, 28h                     ; Standard function prologue
mov  qword ptr[rsp], rbp             ; Standard function prologue
movaps xmmword ptr[rsp + 10h], xmm15 ; Standard prologue (save xmm15)
lea     rbp, [rsp + 28h]

movss  xmm15, xmm0                     ; xmm15 = xmm0 (input parameter, r)
mulss  xmm15, xmm0                     ; xmm15 = xmm15 * xmm0 (r*r)
mulss  xmm15, dword ptr[PI_CONSTANT]   ; xmm15 = xmm15 * PI (PI*r*r)
movss  xmm0, xmm15                     ; xmm0 (return value) = xmm 15

movaps xmm15, xmmword ptr[rsp + 10h]   ; Standard function epilogue (restore xmm15)
mov    rbp, qword ptr[rsp]             ; Standard function epilogue
add  rsp, 28h                          ; Standard function epilogue
ret
This code correctly computes the result of PI * r * r, but the multiply instruction is doing xmm15 = xmm15 * xmm0 instead of xmm0 = xmm0 * xmm0! Because this is on Windows and we’re using the standard Win64 calling convention, where xmm6-xmm15 have to be saved by the callee if they’re used, this causes us to save and restore xmm15 to memory and from memory. This function, which should do two loads and one store (one store+load for the stack pointer, and one load for the constant PI) is doing three loads and two stores (everything we expect, plus an extra store and load for xmm15)!
Let’s try to figure out why xmm15 is being used. If you want to follow along at home, this is at commit 7d3c8b8ff478c409ddb442bd5bc74064367ed8e6 of NativeJIT, inside the AreaOfCircle example. I’m using Visual Studio Community edition, which is available for free here, but you can also follow along with gdb, lldb, or whatever your favorite debugger is.
Let’s set a breakpoint on the JIT compilation step so we can see what happens before and after compilation if you’re following along in Visual Studio, right click on the project and select Set as StartUp Project to make the debugger run this project, then left click on the grey area next to the line of code to set the breakpoint, then hit f5 to run the debugger to step to just before the line is executed.
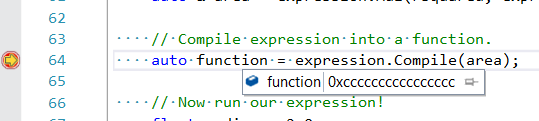
Before the .Compile method is called, our function pointer has the nonsense value of 0xcccccc…. 0xcc is the x86 instruction for INT 3, i.e., software interrupt #3. For debug builds, VC++ fills up unitialized memory to 0xcc so that we’ll have an obvious sign that something went wrong if, for example, we accidentally execute that memory. If we want to verify that the assembly output is what we think it is, we can step over the compile method f10, grab the address in the function variable points to (which is the where .Compile outputs executable code to, and then look at what’s at that address.
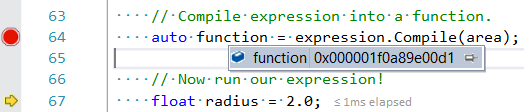
Let’s take a look at 0x1f0a89e00d1 in the disassembly view of our debugger, which will interpret our pile of bytes as assembly. ctrl+alt+d to get dissassembly, and then paste the function address into the “Address” bar:
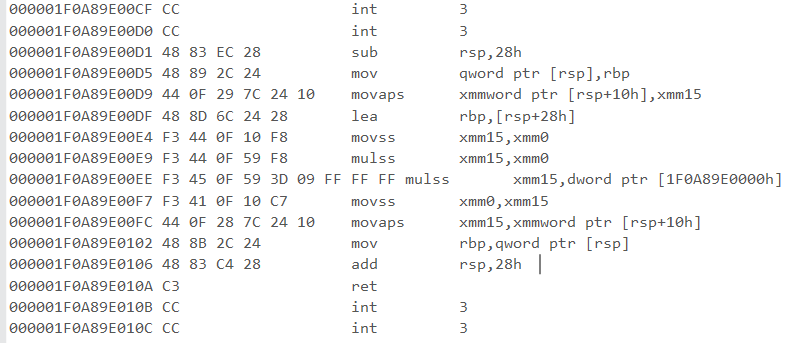
We can see that the disassembly of the function we just compiled has the bug we expected – there’s a move from xmm0 to xmm15, the mulss is done on xmm15, and then the result is copied back to xmm0, and that it’s surrounded by the standard VC++ 0xcc. Since we’ve successfully reproduced the bug, we can start trying to debug. If we were familiar with the code, we might be able to figure out the source of the bug by inspection, but since we’re not (or at least, since I’m not), let’s try restarting the debugger and stepping into the Compile method to see what’s happening when we JIT a function. shift+f5 to stop our current debug session, f5 to start a new one and go back to our breakpoint, f11 to step into the function called on the current line.
template <typename R, typename P1>
typename Function<R, P1>::FunctionType
Function<R, P1>::Compile(Node<R>& value)
{   // Stepped into this line.
    this->template Return<R>(value);
    ExpressionTree::Compile();
    return GetEntryPoint();
}
This might look a bit weird if you’re not familiar with C++ templates. For the purposes of this post, we can think of templates as a text substitution system. Recall from above that we had a function of type <float, float>. That means that the return type, R is float and that the parameter type P1 is also float. The funny syntax around this->template <R>(value) has two explanations. -> means that we’re accessing a member through a pointer (it would be . if accessed through value and not a pointer). The word template is just there to disambiguate <R>; templates were added late to the game in C++, which resulted in a large number of warts, not the least of which is that <R could mean “less than R” or the start of the template parameter named R. We can see that we’re calling the Return method on this. If we peek into Return, we can see that it’s not doing anything particularly interesting and that we should probably look at Compile() to see what’s going on. f10 to step over, f10, f11 to step into.
void ExpressionTree::Compile()
{   // Debugger stepped to this line.
    m_code.Reset();
    m_startOfEpilogue = m_code.AllocateLabel();

    // Generate constants.
    Pass0();

    // Generate code.
    m_code.BeginFunctionBodyGeneration();

    Pass1();
    Pass2();
    Print();
    Pass3();
    ...
    m_code.PlaceLabel(m_startOfEpilogue);
    m_code.EndFunctionBodyGeneration(spec);

    // Release the reserved registers.
    m_reservedRegistersPins.clear();
    m_reservedXmmRegisterStorages.clear();
    m_reservedRxxRegisterStorages.clear();
    Print();
If we peek into m_code.Reset() [click on Reset, Press F12; look around; later, ctrl - to go back], we can see that it’s just some initialization thing that doesn’t do much work. If we do the same for m_code.AllocateLabel(), we can see that it allocates a label in our local jump table, which also seems like an unlikely cause of the bug. If we look at Pass0, we can see something a bit more interesting click on Pass0, f12.
void ExpressionTree::Pass0()
{
    if (IsDiagnosticsStreamAvailable())
    {
        GetDiagnosticsStream() << "=== Pass0 ===" << std::endl;
    }
At the top of Pass0, it looks like we have some kind of diagnostic that’s disabled. Let’s try enabling that and running outside of the debugger to see what sort of information we get with diagnostics enabled. click IsDiagnosticsStreamAvailable, f12.
bool ExpressionTree::IsDiagnosticsStreamAvailable() const
{
    return m_diagnosticsStream != nullptr;
}
We need to set m_diagnosticsStream to something non-null to enable diagnostics. To figure out what we should set it to, let’s look at how GetDiagnosticsStream() works. ctrl+minus to go back to Pass0, click GetDiagnosticsStream, f12
GetDiagnosticStream just returns *m_diagnosticsStream, i.e., it dereferences what m_diagnosticsStream points to. Let’s figure out where that’s initialized. click on it, f12 to go to definition
Left click IsDiagnositicsStreamAvailable, Ctrl+shift+f to find in all files. Click m_code.IsDiagnosticsStreamAvailable(), scroll up.
We can see that there’s an EnableDiagnostics method that lets us pass in a reference to a stream, or that we can pass one into the constructor directly:
ExpressionTree::ExpressionTree(Allocators::IAllocator& allocator, FunctionBuffer& code)
    : m_allocator(allocator),
      m_stlAllocator(allocator),
      m_code(code),
      m_diagnosticsStream(nullptr),
To get diagnostics on stdout, let’s use the standard C++ cout by changingnullptr to &std::cout. make change in code, shift+f5 to stop debugger, f5 to run.
=== Pass0 ===
=== Pass1 ===
=== Pass2 ===
Parameters:
ParameterNode [id = 0, parents = 2, register count = 1, cached in register xmm0s], position = 0

Topological sort:
ParameterNode [id = 0, parents = 2, register count = 1, cached in register xmm0s], position = 0
Operation (imul)  [id = 1, parents = 1, register count = -1, not cached], left = 0, right = 0
ImmediateNode (RIP-indirect) [id = 2, parents = 1, register count = -1, not cached], value = 3.14159
Operation (imul)  [id = 3, parents = 1, register count = -1, not cached], left = 1, right = 2
ReturnNode [id = 4, parents = 1, register count = -1, not cached]

RXX Registers:
rax free
rcx free
rdx free
rbx free
rsp in use
rbp in use
rsi free
rdi free
r8 free
r9 free
r10 free
r11 free
r12 free
r13 free
r14 free
r15 free
rip in use

XMM Registers:
xmm0d in use
xmm1d free
xmm2d free
xmm3d free
xmm4d free
xmm5d free
xmm6d free
xmm7d free
xmm8d free
xmm9d free
xmm10d free
xmm11d free
xmm12d free
xmm13d free
xmm14d free
xmm15d free
Temporaries used: 0
Temporaries still in use: 0

=== Pass3 ===
Parameters:
ParameterNode [id = 0, parents = 2, register count = 1, not cached], position = 0

Topological sort:
ParameterNode [id = 0, parents = 2, register count = 1, not cached], position = 0
Operation (imul)  [id = 1, parents = 1, register count = 2, not cached], left = 0, right = 0
ImmediateNode (RIP-indirect) [id = 2, parents = 1, register count = 0, not cached], value = 3.14159
Operation (imul)  [id = 3, parents = 1, register count = 2, not cached], left = 1, right = 2
ReturnNode [id = 4, parents = 1, register count = 2, not cached]

RXX Registers:
rax free
rcx free
rdx free
rbx free
rsp free
rbp free
rsi free
rdi free
r8 free
r9 free
r10 free
r11 free
r12 free
r13 free
r14 free
r15 free
rip free

XMM Registers:
xmm0d free
xmm1d free
xmm2d free
xmm3d free
xmm4d free
xmm5d free
xmm6d free
xmm7d free
xmm8d free
xmm9d free
xmm10d free
xmm11d free
xmm12d free
xmm13d free
xmm14d free
xmm15d free
Temporaries used: 0
Temporaries still in use: 0

The area of a circle with radius 2 is 12.5664.
Press any key to continue . . .
That’s a lot of output! But, if we look at the register free lists, we can see that after Pass2, xmm0 is in use, and after Pass3, it’s free, but there’s no point at which we have debug information and xmm15 is in use. Recall that when we stepped into Compile, there was a call to Print immediate after Pass2, and another call to Print before the end. Let’s try adding calls to Print between each pass to see if we can get enough diagnostic information to see when we’re incorrectly deciding to allocate xmm15.
insert Print between each pass and before Pass0; ctrl+f5
It’s a lot to look at, so I’m going not going to paste in information on the RXX registers, although it’s pretty curious that in the diagnostic dump above the instruction pointer, rip, is allocated after Pass2 and free after Pass3. What could that mean? But that’s a digression and we have a bug to debug, so let’s look at what we’ve got in the xmm registers:
Parameters:
ParameterNode [id = 0, parents = 2, register count = -1, not cached], position = 0

Topological sort:
ParameterNode [id = 0, parents = 2, register count = -1, not cached], position = 0
Operation (imul)  [id = 1, parents = 1, register count = -1, not cached], left = 0, right = 0
ImmediateNode (RIP-indirect) [id = 2, parents = 1, register count = -1, not cached], value = 3.14159
Operation (imul)  [id = 3, parents = 1, register count = -1, not cached], left = 1, right = 2
ReturnNode [id = 4, parents = 1, register count = -1, not cached]

...

XMM Registers:
xmm0d free
xmm1d free
xmm2d free
xmm3d free
xmm4d free
xmm5d free
xmm6d free
xmm7d free
xmm8d free
xmm9d free
xmm10d free
xmm11d free
xmm12d free
xmm13d free
xmm14d free
xmm15d free
Temporaries used: 0
Temporaries still in use: 0

=== Pass0 ===
Parameters:
ParameterNode [id = 0, parents = 2, register count = -1, not cached], position = 0

Topological sort:
ParameterNode [id = 0, parents = 2, register count = -1, not cached], position = 0
Operation (imul)  [id = 1, parents = 1, register count = -1, not cached], left = 0, right = 0
ImmediateNode (RIP-indirect) [id = 2, parents = 1, register count = -1, not cached], value = 3.14159
Operation (imul)  [id = 3, parents = 1, register count = -1, not cached], left = 1, right = 2
ReturnNode [id = 4, parents = 1, register count = -1, not cached]

...

XMM Registers:
xmm0d free
...
xmm15d free
Temporaries used: 0
Temporaries still in use: 0

=== Pass1 ===
Parameters:
ParameterNode [id = 0, parents = 2, register count = 1, cached in register xmm0s], position = 0

Topological sort:
ParameterNode [id = 0, parents = 2, register count = 1, cached in register xmm0s], position = 0
Operation (imul)  [id = 1, parents = 1, register count = -1, not cached], left = 0, right = 0
ImmediateNode (RIP-indirect) [id = 2, parents = 1, register count = -1, not cached], value = 3.14159
Operation (imul)  [id = 3, parents = 1, register count = -1, not cached], left = 1, right = 2
ReturnNode [id = 4, parents = 1, register count = -1, not cached]

...

XMM Registers:
xmm0d in use
...
xmm15d free
Temporaries used: 0
Temporaries still in use: 0

=== Pass2 ===
Parameters:
ParameterNode [id = 0, parents = 2, register count = 1, cached in register xmm0s], position = 0

Topological sort:
ParameterNode [id = 0, parents = 2, register count = 1, cached in register xmm0s], position = 0
Operation (imul)  [id = 1, parents = 1, register count = -1, not cached], left = 0, right = 0
ImmediateNode (RIP-indirect) [id = 2, parents = 1, register count = -1, not cached], value = 3.14159
Operation (imul)  [id = 3, parents = 1, register count = -1, not cached], left = 1, right = 2
ReturnNode [id = 4, parents = 1, register count = -1, not cached]

...

XMM Registers:
xmm0d in use
...
xmm15d free
Temporaries used: 0
Temporaries still in use: 0

=== Pass3 ===
Parameters:
ParameterNode [id = 0, parents = 2, register count = 1, not cached], position = 0

Topological sort:
ParameterNode [id = 0, parents = 2, register count = 1, not cached], position = 0
Operation (imul)  [id = 1, parents = 1, register count = 2, not cached], left = 0, right = 0
ImmediateNode (RIP-indirect) [id = 2, parents = 1, register count = 0, not cached], value = 3.14159
Operation (imul)  [id = 3, parents = 1, register count = 2, not cached], left = 1, right = 2
ReturnNode [id = 4, parents = 1, register count = 2, not cached]

...

XMM Registers:
xmm0d free
...
xmm15d free
Temporaries used: 0
Temporaries still in use: 0

The area of a circle with radius 2 is 12.5664.
Press any key to continue . . .
If we look at the free lists, we still don’t see any point at which xmm15 is allocated. But at least we know that Pass0 doesn’t even allocate xmm0, so it’s unlikely to contain the source of the bug. By Pass1, xmm0 is allocated, so let’s step into Pass1 with our debugger. [click Pass1; ctrl+f10 to step to; f11 to step into]
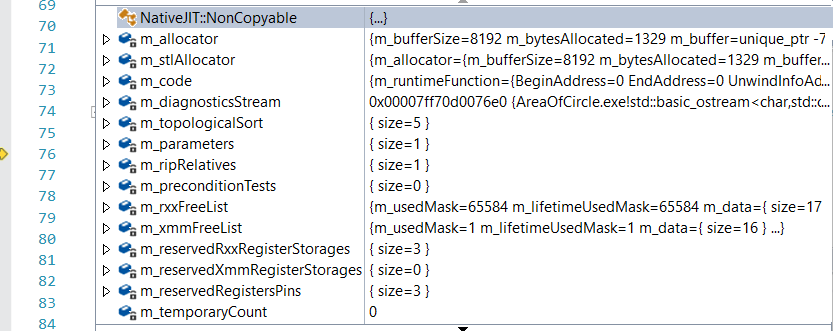
We can see that in Pass1, for each parameter we have, we call something called CodeGenCache, and that we have a single parameter (our debugger tells us that the size of the m_parameters container is 1), and that that parameter has a parentCount of 2. That seems reasonable – we know that our function takes one parameter, r, and it makes sense that it’s “referenced” twice. GetParentCount seems unlikely to be interesting, so let’s step into CodeGenCache click on line, ctrl+f10, f11
template <typename T>
void Node<T>::CodeGenCache(ExpressionTree& tree)
{
    LogThrowAssert(GetParentCount() > 0,
        "Cannot evaluate node %u with no parents",
        GetId());
    LogThrowAssert(!HasBeenEvaluated(),
        "Tried to CodeGenValue() node with ID %u more than once",
        GetId());
    MarkEvaluated();

    LabelSubtree(true);
    SetCache(CodeGenValue(tree));
}
If we quickly peek into the functions here, MarkEvaluated, LabelSubtree, CodeGenValue, and SetCache, click, f12, ctrl+minus we can see that they’re not doing any interesting work, and that they’re setting values we can see in the parameters section of the diagnostic dump we looked at earlier. Let’s skip out of Node<T>::CodeGenCache shift+f11.
If we mouse over the next loop in Pass1, we can see that the loop is going to fall through and we can just skip out of Pass1 shift+f11 and look at Pass2 f10 to skip over Print, f11,
void ExpressionTree::Pass2()
{
    if (IsDiagnosticsStreamAvailable())
    {
        GetDiagnosticsStream() << "=== Pass2 ===" << std::endl;
    }

    for (unsigned i = 0 ; i < m_topologicalSort.size(); ++i)
    {
        NodeBase& node = *m_topologicalSort[i];

        if (node.GetParentCount() > 1 && !node.HasBeenEvaluated())
        {
            node.CodeGenCache(*this);
        }
    }
}
This looks superficially similar to Pass, except we call a method on nodes with more than one parent instead of calling one on nodes that are parameters. It’s plausible that the bug could be here since the bug involves a node with two identical parents. But if we step over functions in Pass2 f10, f10, f10, …, we can see that our Node that has GetParentCount() > 1 was marked as evaluated in Pass1, so this pass doesn’t do anything and the bug is unlikely to be here, so we can leave Pass2 and check out out Pass3 f10 until we’re out of Pass2, f10 to skip over Print, f11 into Pass3.
void ExpressionTree::Pass3()
{
    if (IsDiagnosticsStreamAvailable())
    {
        GetDiagnosticsStream() << "=== Pass3 ===" << std::endl;
    }

    NodeBase& root = *m_topologicalSort.back();

    // LogThrowAssert(Root node is return, "Root must be a return node.");

    root.LabelSubtree(true);
    root.CompileAsRoot(*this);
}
In order to avoid making this post unreasonably long (hah), I’ll give you a spoiler and tell you that if you trace what’s happening in LabelSubtree, it recursively looks at each node and computes how many registers it expects the node to use, but it doesn’t seem to cause any actual register allocation, so let’s skip to CompileAsRoot. click, ctrl+f10, f11
template <typename T>
void ReturnNode<T>::CompileAsRoot(ExpressionTree& tree)
{
    ExpressionTree::Storage<T> s = this->CodeGen(tree);

    auto resultRegister = tree.GetResultRegister<T>();

    // Move result into the result register unless already there.
    if (!(s.GetStorageClass() == StorageClass::Direct
        && s.GetDirectRegister().IsSameHardwareRegister(resultRegister)))
    {
        CodeGenHelpers::Emit<OpCode::Mov>(tree.GetCodeGenerator(), resultRegister, s);
    }
}
This looks promising! The comment saying Move result into the result register unless already there probably indicates that the code block underneath the comment, well, moves the result into the result register unless already there. CodeGenHelpers::Emit<> appears to emit an actual x86 opcode that we’ll be able to execute. Given that the bottom block is emitting actual code, and all of the passes we’ve seen so far just set values of members, the CodeGen call at the top of this function probably emits the actual code for the function. It’s possible that the bug is in one of the earlier passes that’s setting values, but if so, it’s not currently obvious which values should be changed, and it should be possible to figure out which value was set incorrectly once we see the bogus mov to xmm15 from xmm0 opcode is emitted since we’ll know why that opcode was emitted. Let’s step into CodeGen(tree). f10, f11.
template <typename T>
typename ExpressionTree::Storage<T> Node<T>::CodeGen(ExpressionTree& tree)
{
    if (!IsCached())
    {
        CodeGenCache(tree);
    }
    return GetAndReleaseCache();
}
Wait, what happened? This call to CodeGenCache looks pretty similar to what we saw in earlier passes. Well, let’s step into CodeGenCache to see if it’s any different from before. click, shift+f10, f11. That puts us into CodeGenCache, again. Welp, let’s step into CodeGenValue to see if tha’s any different click, ctrl+f10, f11.
template <typename T>
typename ExpressionTree::Storage<T> ReturnNode<T>::CodeGenValue(ExpressionTree& tree)
{
    LogThrowAssert(this->GetParentCount() == 1,
        "Unexpected parent count for the root node: %u",
        this->GetParentCount());

    return m_child.CodeGen(tree);
}
This is actually different from what we saw when we looked at CodeGenCache last time. If we look at the local variables in our debugger, we can see that this is a ReturnNode, so we’re apparently calling CodeGenValue method for a ReturnNode, which then calls CodeGen on the tree that we passed in. If we look at the tree in the debugger, the tree seems to have all of the values we set in the previous passes.
Let’s step into CodeGen to see what that does. click, ctrl+f10, f11. This looks familiar (it calls CodeGenCache, which we can step into click, ctrl+f10, f11. We’re now in CodeGenCache, but if we look at our local variables, we can see that this is now a BinaryNode<7, float, float> instead of aReturnNode. To see what that7means, let’s look atBinaryNode_click,f12_, and then look at the definition ofOpcode_click,f12_.Opcodeturns out to be anenum, where7indicates anIMul`:
enum class OpCode : unsigned
{
    Add,
    And,
    Call,
    Cmp,
    CvtFP2FP,
    CvtFP2SI,
    CvtSI2FP,
    IMul,
    Lea,
    Mov,
    MovSX,
    MovZX,
    MovAP,      // Aligned 128-bit SSE move.
    Nop,
    Or,
    Pop,
    Push,
    Ret,
    Rol,
    Shl,        // Note: Shl and Sal are aliases, unlike Shr and Sar.
    Shld,
    Shr,
    Sub
    Xor,
    // The following value must be the last one.
    OpCodeCount
};
This is a bit strange since IMul in x86 means an integer multiply, but we have a node that takes two floats. The operations that convert float to integer or visa versa are named after x86 opcodes, as are things like shld, which are weirdo x86 things that aren’t general concepts. Based on the list of opcodes, and the fact that we know that NativeJIT can emit floating point code, I’m going to guess that there was a time when NativeJIT only supported integer operations, and that when floating point support was added, instruction/method names got overloaded.
Let’s go into the next CodeGenValue to see where that takes us click, ctrl+f10, f11.
template <OpCode OP, typename L, typename R>
typename ExpressionTree::Storage<L> BinaryNode<OP, L, R>::CodeGenValue(ExpressionTree& tree)
{
    Storage<L> sLeft;
    Storage<R> sRight;

    this->CodeGenInPreferredOrder(tree,
        m_left, sLeft,
        m_right, sRight);

    CodeGenHelpers::Emit<OP>(tree.GetCodeGenerator(), sLeft.ConvertToDirect(true), sRight);

    return sLeft;
}
This looks interesting, but we really need to know what a storage is. click on Storage, f12. This takes us to ExpressionTreeDecls.h, which is almost 600 lines long and consists mostly of comments. That’s a bit long to paste in here, but after reading the comments my interpretation is that a Storage is a thing that keeps track of where a particular piece of data can be stored, which can be Direct (a register), Indirect (somewhere in memory), and Immediate (the immediate field of an x86 instruction). The next thing to do would be to step into CodeGenInPreferredOrder, but I accidentally pressed f10 instead of f11 and stepped over it. Oops.
We could fix that by setting a breakpoint on CodeGenInPreferredOrder and restarting, but before we do that, let’s look around to see what we have in CodeGenInPreferredOrder. click, f12
void NodeBase::CodeGenInPreferredOrder(ExpressionTree& tree,
                                       Node<T1>& n1, Storage<T1>& s1,
                                       Node<T2>& n2, Storage<T2>& s2)
    {
        // Evaluate the expression which uses more registers first.
        if (n1.GetRegisterCount() >= n2.GetRegisterCount())
        {
            s1 = n1.CodeGen(tree);
            s2 = n2.CodeGen(tree);
        }
        else
        {
            s2 = n2.CodeGen(tree);
            s1 = n1.CodeGen(tree);
        }
}
It looks like this recursively calls CodeGen, starting at the root of the tree and going down. That sounds maybe important, but let’s look at what else we call from this level first. ctrl+minus In ConvertToDirect, we have this highly suspicious chunk of code: click, f12
case StorageClass::Direct:
// If the storage is already direct, action is only necessary if it
// needs to be modified but we're not the sole owner.
if (!IsSoleDataOwner() && forModification)
{
    auto dest = tree.Direct<T>();

    // There's a possibility that the current register may get spilled
    // by the allocation, so move from Storage instead of from register.
    CodeGenHelpers::Emit<OpCode::Mov>(code,
    dest.GetDirectRegister(),
    *this);
    SetData(dest);
}
break;
If we refer to (use?) a register for modification, and “we” aren’t the sole owner, we copy (Mov) the register elsewhere before modifying it. Let’s look at what it means to be the sole owner: f12
template <typename T>
bool ExpressionTree::Storage<T>::IsSoleDataOwner() const
{
    return IsNull() || m_data->GetRefCount() == 1;
}
If something has a ref count of 1, then the modifier is the sole owner. This seems very likely to be the bug or related to the bug. Because our parameter has two nodes pointing to it, its ref count will be 2, so it will fail the IsSoleOwner check. There are a lot of possible fixes for this, so let’s try a simple local fix to see if that fixes the problem, and think about making a different fix if we don’t like the local fix:
--- a/inc/NativeJIT/Nodes/BinaryNode.h
+++ b/inc/NativeJIT/Nodes/BinaryNode.h
@@ -77,11 +77,23 @@ namespace NativeJIT
Storage<R> sRight;

this->CodeGenInPreferredOrder(tree,
-                             m_left, sLeft,
-                             m_right, sRight);
-
-     CodeGenHelpers::Emit<OP>(tree.GetCodeGenerator(), sLeft.ConvertToDirect(true), sRight);
+                                                       m_left, sLeft,
+                                                       m_right, sRight);

+         if (sLeft == sRight)
+         {
+             sRight.Reset();
+             CodeGenHelpers::Emit<OP>(tree.GetCodeGenerator(),
+                                      sLeft.ConvertToDirect(true), sLeft);
+         }
+         else
+         {
+             CodeGenHelpers::Emit<OP>(tree.GetCodeGenerator(),
+                                      sLeft.ConvertToDirect(true), sRight);
+         }
If our two Storages are the same, we can free one, reducing the ref count to 1, which makes the IsSoleOwner condition true. Let’s try re-running with our fix to see if PI * r * r produces the code we now want. _shift+f5 to stop debugging, f5, f10, inspect the output of our function as before
00000197504D00D5  int           3
00000197504D00D6  int           3
00000197504D00D7  sub           rsp,8
00000197504D00DB  mov           qword ptr [rsp],rbp
00000197504D00DF  lea           rbp,[rsp+8]
00000197504D00E4  mulss         xmm0,xmm0
00000197504D00E8  mulss         xmm0,dword ptr [197504D0000h]
00000197504D00F1  mov           rbp,qword ptr [rsp]
00000197504D00F5  add           rsp,8
00000197504D00F9  ret
00000197504D00FA  int           3
00000197504D00FB  int           3
Great! The mov to xmm15 is gone and we do, in fact, produce PI * r * r. This fix seems non-optimal, because, for example, PI * r * r *r * r could theoretically be done by doing
mulss xmm0, xmm0
mulss xmm0, xmm0
mulss xmm0, [PI]
But we can’t generalize our fix to always use the same register if we always refer to the same register since we’d actually emit the above code for PI * r * r * r. It’s possible to do the correct optimization for both PI r^3 and PI r^4, but one of the main design goals for NativeJIT makes that optimization non-trivial. This is used in Bing to compile queries, so the time it takes to compile something is critical, which is why such a dumb/fast register allocation algorithm was chosen. It might be possible to make that change without impacting compilation performance, but it’s not immediately obvious to me how to do so, so this seems like an ok fix.
If we back at the original output, we can see that there’s actually a second bug lurking:
PI_CONSTANT:
db 0f 49 40                          ; PI is stored in memory as a constant.
ENTRY_POINT:
sub     rsp, 28h                     ; Standard function prologue
mov  qword ptr[rsp], rbp             ; Standard function prologue
movaps xmmword ptr[rsp + 10h], xmm15 ; Standard prologue (save xmm15)
lea     rbp, [rsp + 28h]

movss  xmm15, xmm0                     ; xmm15 = xmm0 (input parameter, r)
mulss  xmm15, xmm0                     ; xmm15 = xmm15 * xmm0 (r*r)
mulss  xmm15, dword ptr[PI_CONSTANT]   ; xmm15 = xmm15 * PI (PI*r*r)
movss  xmm0, xmm15                     ; xmm0 (return value) = xmm 15

movaps xmm15, xmmword ptr[rsp + 10h]   ; Standard function epilogue (restore xmm15)
mov    rbp, qword ptr[rsp]             ; Standard function epilogue
add  rsp, 28h                          ; Standard function epilogue
ret
We’ve already seen and fixed the bug that causes a second register to be used. The other bug is that, given that a second register is used, NativeJIT selects a “callee save” register, i.e., a register that the called function has to save because it might be used by the calling function. The correct thing to do is to use “caller save” registers until none are available, and only use callee save registers as a last resort. Although I had fun exploring the codebase and figuring this bug out, I’m not going to write that up because it’s more of the same.
Conclusion
I was pleasantly surprised to find out how easy it was to debug a bug in an unfamiliar codebase using a language I don’t have much experience in. It helped that the code is pretty much self-contained and doesn’t have any of the problems that make code really hard to understand (non-descriptive variable or function names, globals, long functions with no obvious purpose, etc.). Using an IDE was also really helpful. I had low expectations coming in because VC++ is, frankly, just not as nice a compiler as clang or gcc (worse error messages, worse standards compliance, etc.). But that’s not really noticeable when debugging, and the IDE integration is quite good.
The last time I did any C or C++, I used Emacs + ctags or etags for navigation. That’s ok, but ctags and etags, fundamentally, rely on string matching, which often results in incorrect symbol resolution. It looks like there’s now something called rtags that uses clang to generate relationships between symbols. If that works as advertised, I’d be happy to switch – Visual Studio is pretty heavyweight (IIRC, the installer for “community edition was 8GB, and it didn’t even install the C++ compiler until I opened a C++ project), and I’ve run into some weird bugs that (I’m guessing) stem from its complexity. I didn’t hit any bugs while debugging, but after I finished, a Windows forced update that required a restart caused VS to get into a broken state after I opened VS again. I tried to restart VS, but that gave me an error message that told me I’d have to restart before being able to restart.
But I’ve also run into bugs while using gdb and lldb; one debugging session isn’t really enough to say if VS is buggier or not.
In terms of the codebase, it’s relatively easy to understand for heavily templated C++ code, considering that I haven’t done C++ for ages; I’m looking forward to working more with this codebase.
Thanks to Lisa Neigut, Darius Bacon, Leah Hanson, Julia Evans, Mike Hopcroft, and David Turner for comments/corrections/discussion, and again to Julia Evans for pair programming for part of the debugging process.